
To run a successful business, you need to know the numbers.
The same goes for the hotel industry. You should know the Hotel KPIs to keep track of the revenue stream, performance, and operational aspects.
The logic is simple: if you can’t measure it, you can’t improve it.
KPIs for the hotel industry help hoteliers evaluate performance, optimize service efficiency, and drive profits. These KPIs range from daily operations to financial performance, sales, marketing, and customer service.
With a better understanding of how and why to use metrics, you can steer the hotel business in the right direction. Therefore, based on data, you can strategically propel your business forward and position yourself against competitors.
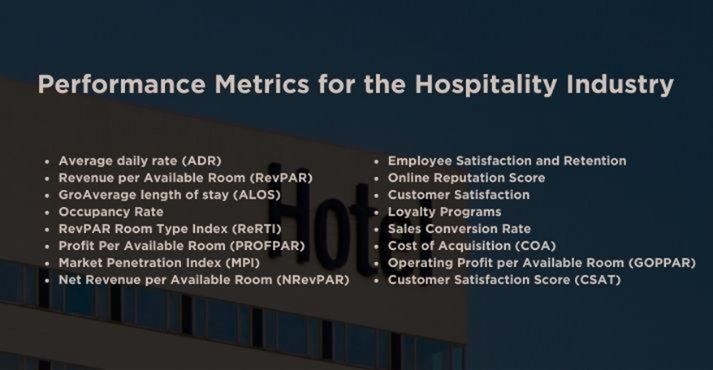
We’ve compiled a comprehensive list of 16 key metrics applicable to the hospitality industry. Let us now look at the Hotel KPIs which need to be closely by hoteliers.
What are Hotel KPIs?
Hotel industry KPIs are associated with goals. Hotel KPIs refer to the essential data points that hotelier use to measure the performance and success of their establishments. KPIs measure how well a hotel performs year over year and as well against competition.
Hotel owners, managers, and department heads use these KPIs for evaluating hotel performance based on these metrics to track the success of marketing strategies, how well managers perform, identify market trends, and forecast growth.
Let’s explore the KPIs for the hotel industry.
1. Average daily rate (ADR)
Average daily rate (ADR) refers to the average rate at which each room at the hotel is sold on a given day. It identifies ADR changes at different times, during low and peak seasons, weekends, and weekdays. Tracking this KPI can help identify areas for improvement in a hotel’s rate strategy.
To calculate:
It is calculated by taking the Average room revenue and dividing it by the total number of rooms sold.
ADR= Rooms Revenue / Occupied Rooms
For example, if the total revenue earned from 30 occupied rooms is 20000 USD, the ADR will be: Hotel ADR = 20000/30 = 667 USD.
2. Revenue per Available Room (RevPAR)
Revenue per Available Room (RevPAR) refers to the insight into the number of rooms sold at a hotel and how much revenue is generated from those bookings.
It could also act as a productivity indicator for a hotel investor. Strong RevPAR is achieved when both occupancy and ADR rates are strong.
To calculate:
It is calculated by multiplying the hotel’s average daily rate by the occupancy rate.
RevPAR = Average Daily Rate X Occupancy Rate%
For example, if the average daily rate is $150 and the occupancy rate is 80%, the Revenue per Available Room (RevPAR) will be $120.
3. Gross Operating Profit per Available Room (GOPPAR)
Gross operating profit per available room (GOPPAR) is the measure of gross operating profit per available room. It helps the hotelier to see profit across all revenue centers/the sum of all the parts- not just rooms.
To calculate:
It is calculated by taking the monthly gross operating profit and dividing it by the total number of rooms available.
GOPPAR = GOP (gross operating profit) / (per) Available Rooms
For example, GOP is $50,000, and available rooms are 100, so the GOPPAR will be $500. It means that, on average, each available room contributes $500 in gross operating profit.
4. Customer Satisfaction Score (CSAT)

Customer satisfaction score refers to the quality of the service and measure of guest satisfaction based on feedback and surveys. CSAT help hotelier to improve hotel operations by meeting the needs and expectations of their guests.
To calculate:
It can be calculated through surveys, reviews, and direct feedback. Ongoing quality checks and analysis of CSAT reduce negative word-of-mouth.
For example, to calculate a customer satisfaction score (CSAT), you typically ask customers to rate their satisfaction on a scale of 1-5 or 1-10.
5. Average length of stay (ALOS)
The average length of stay (ALOS) refers to the number of nights a guest stays at the hotel over a certain period. By monitoring ALOS, hotels can work to boost room and occupancy rates by maximizing the number of nights travelers book at their property.
To calculate:
It can be calculated by dividing the total number of occupied room nights by the total number of bookings.
ALOS = Total # of Occupied Room Nights / # of Bookings
For example, if the total number of occupied room nights is 500 and the total number of bookings is 200, the ALOS of the hotel would be 2.5 nights. It means that, on average, a guest spends 2.5 nights at your hotel.
6. Occupancy Rate
Hotel occupancy rate refers to the percentage of available rooms occupied by guests. It is essential to understand the occupancy rate at a regular, recurring interval and forecast accordingly. It also helps in revenue management. Hoteliers use diverse pricing strategies to maintain the occupancy threshold.
To calculate:
It can be calculated by dividing the number of rooms sold by the total number of available rooms and multiplying by 100.
Occupancy rate = (Number of Rooms Sold / Total Number of Available Rooms) X 100
For example, if 80 rooms are sold and 100 rooms are available, the hotel’s occupancy percentage would be 80%.
7. RevPAR Room Type Index (ReRTI)
RevPAR room type index evaluates the revenue performance of different room types compared to the overall revenue per available room (RevPAR).
Understanding whether specific room types contribute more or less to a hotel’s total revenue is essential, helping hoteliers make informed decisions about pricing, guest experience, marketing, and resource allocation to optimize profitability.
To calculate:
It is calculated by dividing the RevPAR of a specific room type by the overall RevPAR and multiplying it by 200.
ReRTI = (RevPAR of Specific Room Type / Overall RevPAR) X 100
For example, suppose the RevPAR of a specific room type (e.g., deluxe rooms) is $150, and the overall RevPAR for the entire hotel is $120. In that case, the ReRTI for the deluxe rooms will be 125, indicating that this specific room type generates 25% more revenue per available room than the overall RevPAR of the entire hotel.
8. Profit Per Available Room (PROFPAR)
Profit per available room (PROFPAR) is an essential KPI in the hotel industry that measures the profit generated per available room after deducting all operating expenses.
It is a beneficial metric to analyze how a hotel effectively generates its share of profit and whether or not to sacrifice its Average Daily Rate (ADR) for more sales.
To calculate:
It is calculated by subtracting the total revenue from total operating expenses and dividing it by the number of rooms sold.
PROFPAR = (Total Revenue – Total Operating Expenses) / Number of Rooms Sold
For example, if the monthly revenue is $50,000, the total operating expenses are $20,000, and the number of rooms sold for the month is 100. The profit per available room (PROFPAR) for the month is $300. It means, on average, you made $300 in profit for each room sold during that month after covering your operating expenses.
9. Market Penetration Index (MPI)
Market Penetration Index (MPI) is a metric comparing the hotel’s actual market share to its potential market share. MPI compares your hotel’s occupancy to the average occupancy of your competitors.
It is an important KPI to understand if your revenue management and marketing strategies are working and the level of the establishment’s attractiveness to capture customer attention.
To calculate:
It can be calculated by the hotel’s occupancy percentage divided by the market’s occupancy percentage and multiplied by 100.
MPI = (Hotel’s Occupancy Percentage / Market’s Occupancy Percentage) X 100
For example, if the hotel’s occupancy percentage is 75% and the market’s occupancy percentage is 80%, the MPI of the hotel in comparison to the market will be 93.75.
10. Net Revenue per Available Room (NRevPAR)
Like RevPAR, NRevPAR considers net revenue, deducting travel agent commissions and other distribution costs. NRevPAR reflects a property’s ability to fill its available rooms at an average rate.
To calculate:
It can be calculated by dividing the net revenue by the number of rooms sold at a hotel during a specific period.
RevPAR = (Net Revenue / Number of Rooms Sold)
For example, if the net revenue for the month is $40,000, and the number of rooms sold is 100, the Net Revenue per Available Room (NRevPAR) for the month is $400. This means, on average, you earned $400 in net revenue for each room sold during that month after accounting for expenses like travel agent commissions and other distribution costs.
11. Employee Satisfaction and Retention
Employee satisfaction and retention refers to measuring employee satisfaction and the retention rate. This KPI focuses on the hotel’s workforce, measuring employee satisfaction, engagement, and retention rates.
It can be measured through surveys, turnover rates, and exit interviews to analyze the ability of the hotel to attract and retain talented staff. By analyzing this KPI, hotels can assess the satisfaction level of their employees and take necessary actions to improve retention rates.
12. Online Reputation Score

Online reputation score refers to assessing the hotel’s online reputation based on reviews and ratings. This score indicates the trust and credibility associated with a particular hotel.
With dozens of review sites like TripAdvisor, Yelp, and Online Travel Agencies (OTAs) such as Expedia, customers are placing their trust in hotel reviews while booking accommodation. Also, social media platforms have become a place for social proof.
The stats show that 97.7% of customers read other travelers’ online reviews, 92% trust reviews of their close family and friends, 53% will only book a hotel with reviews, and 77.9% believe reviews are extremely important for deciding where to stay.
13. Customer Satisfaction
Delivering an optimal guest experience is the core of every business in the hospitality industry. Customer satisfaction surveys provide a holistic view of guest experiences, offering valuable data for improvement.
“Wow” moments become moments that matter as they become more satisfied, and it fuels customer loyalty. Therefore, measuring the satisfaction scores and analyzing them at every touchpoint is essential.
Here are some ways to gain customer satisfaction insights:
- Diversity feedback capture methods
- Capture feedback along the entire guest journey
- Proactively recover guest service issues at the moment
- Increase customer satisfaction by closing the feedback loop
- Set up a dashboard using tools to track insights
Here are some important KPIs to keep track of customer satisfaction:
- Net Promoter Score (NPS)
- Customer Relationship Management (CRM) tool
- Customer Effort Score (CES)
Remember, no business can have 100% satisfied customers, but they can improve the number by strategically using data insights to improve customer experience at the hotel.
14. Loyalty Programs
Loyalty programs measure the success of hotel customer loyalty programs, which is crucial for understanding and optimizing the guest experience. Hoteliers can gain deep insights into guest behaviors by analyzing customer preferences, purchase patterns, and interactions with the loyalty program.
Metrics to evaluate the effectiveness of the hotel loyalty programs:
QuantitativeKPIs:
- Member engagement rate
- Lift in Member Value
- New Acquisitions through the program
Qualitative KPI’s
- Increase in the CSAT score
- More referrals from the members
- Positive sentiments about the program on social platforms
15. Sales Conversion Rate
Sales conversion rate refers to the percentage of inquiries or leads that result in confirmed bookings. If you don’t know how the sales team works, you won’t be able to improve your results. It is essential to analyze this rate as it will help you optimize the user path to maximize the conversion rate.
To calculate:
It can be calculated by dividing the number of bookings by the number of inquiries and multiplying it by 100.
Sales conversion rate = (Number of Bookings / Number of Inquiries) X 100
For example, if the number of bookings is 30 and the number of inquiries is 300, the sales conversion rate would be 10%. It’s a valuable metric to assess the campaign’s effectiveness in converting leads into customers.
16. Cost of Acquisition (COA)
The cost of acquisition refers to the total cost to acquire a new customer. These costs include marketing and distribution expenses such as advertising, fees, and commissions, but technology, labor, and other expenses may also be included.
To calculate:
It can be calculated by dividing the total sales and marketing expenses by the number of new customers acquired.
COA = Total Sales and Marketing Expenses / Number of New Customers Acquired
For example, if a hotelier spends $125,000 on sales and marketing in a month, and 50 new customers are acquired during the same month, the COA will be $2,500.
Conclusion
As hospitality industry trends evolve, providing exceptional guest experiences and maintaining operational efficiency becomes essential to achieving business goals.
These 16 Hotel KPIs will help hoteliers improve revenue management, guest satisfaction, and operational effectiveness, enabling businesses to make data-driven decisions, optimize pricing strategies, and enhance overall service quality.
By consistently measuring and analyzing these performance indicators, hospitality businesses can navigate challenges, seize opportunities, and deliver memorable experiences that keep guests coming back for more.
Staying informed and proactive in tracking these metrics is essential for staying competitive.